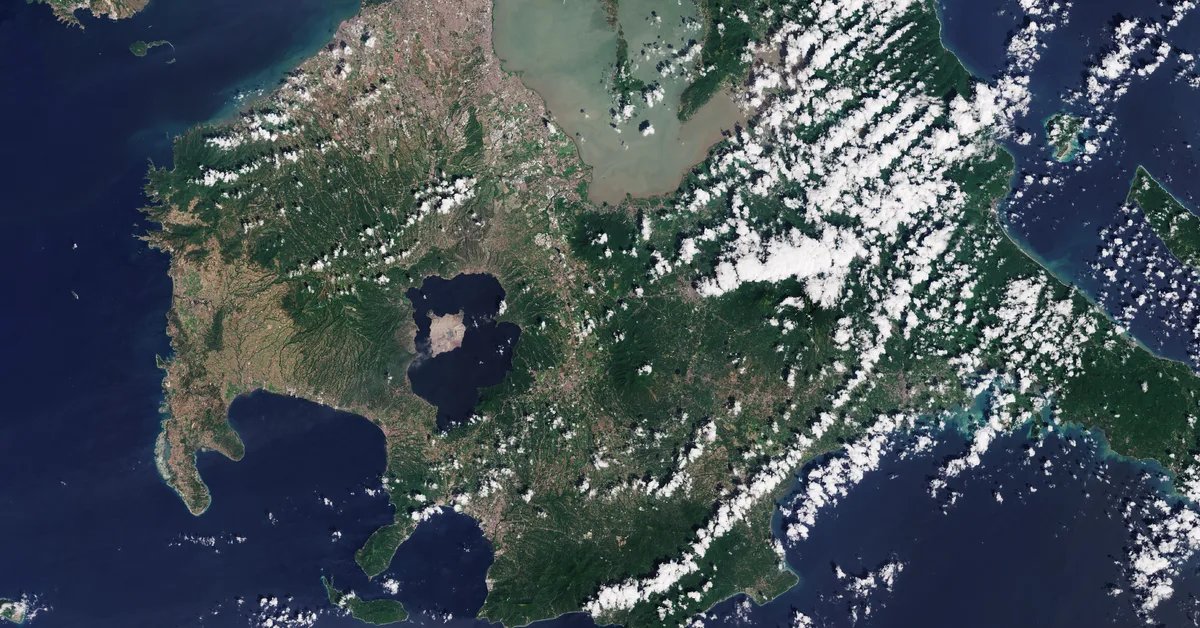
Taal 2020: an eruption seen by radar and optical satellites
🌋 On 12 January 2020, Taal volcano in the Philippines woke up after 43 years of quiet. Within a single afternoon, steam explosions in the Main Crater turned into a towering ash column, the alert level jumped from 1 to 4, and more than half a million people living around Taal Lake were affected. Satellites were watching, and two very different kinds of sensor tell the story: optical images show what the eruption left on the surface, while radar reveals what was happening underground.
A sudden awakening
Earthquake swarms started late in the morning, followed by a steam-driven (phreatic) eruption from the Main Crater around 1 pm local time. By the evening, the eruption column reached 10 to 15 km, with frequent volcanic lightning and wet ash falling as far north as Quezon City in Metro Manila. In the early hours of 13 January, lava fountains rose from the crater.
PHIVOLCS called for the total evacuation of Volcano Island and of the high-risk areas within 14 km of the Main Crater. Over the following days, hundreds of volcanic earthquakes were recorded, and fissures cracked open roads and fields in Lemery, Agoncillo, Talisay and San Nicolas. By 15 January, the lake that had filled the Main Crater was gone.
Watching the ground move
Synthetic aperture radar (SAR) satellites such as Sentinel-1 measure the distance to the ground with millimetre-level precision. Comparing two acquisitions of the same area, an interferogram, turns tiny changes in that distance into colour bands called fringes. For Sentinel-1’s C-band radar, each full colour cycle corresponds to about 2.8 cm of ground motion towards or away from the satellite.
Swipe across the image below to compare the post-eruption landscape with the interferogram.
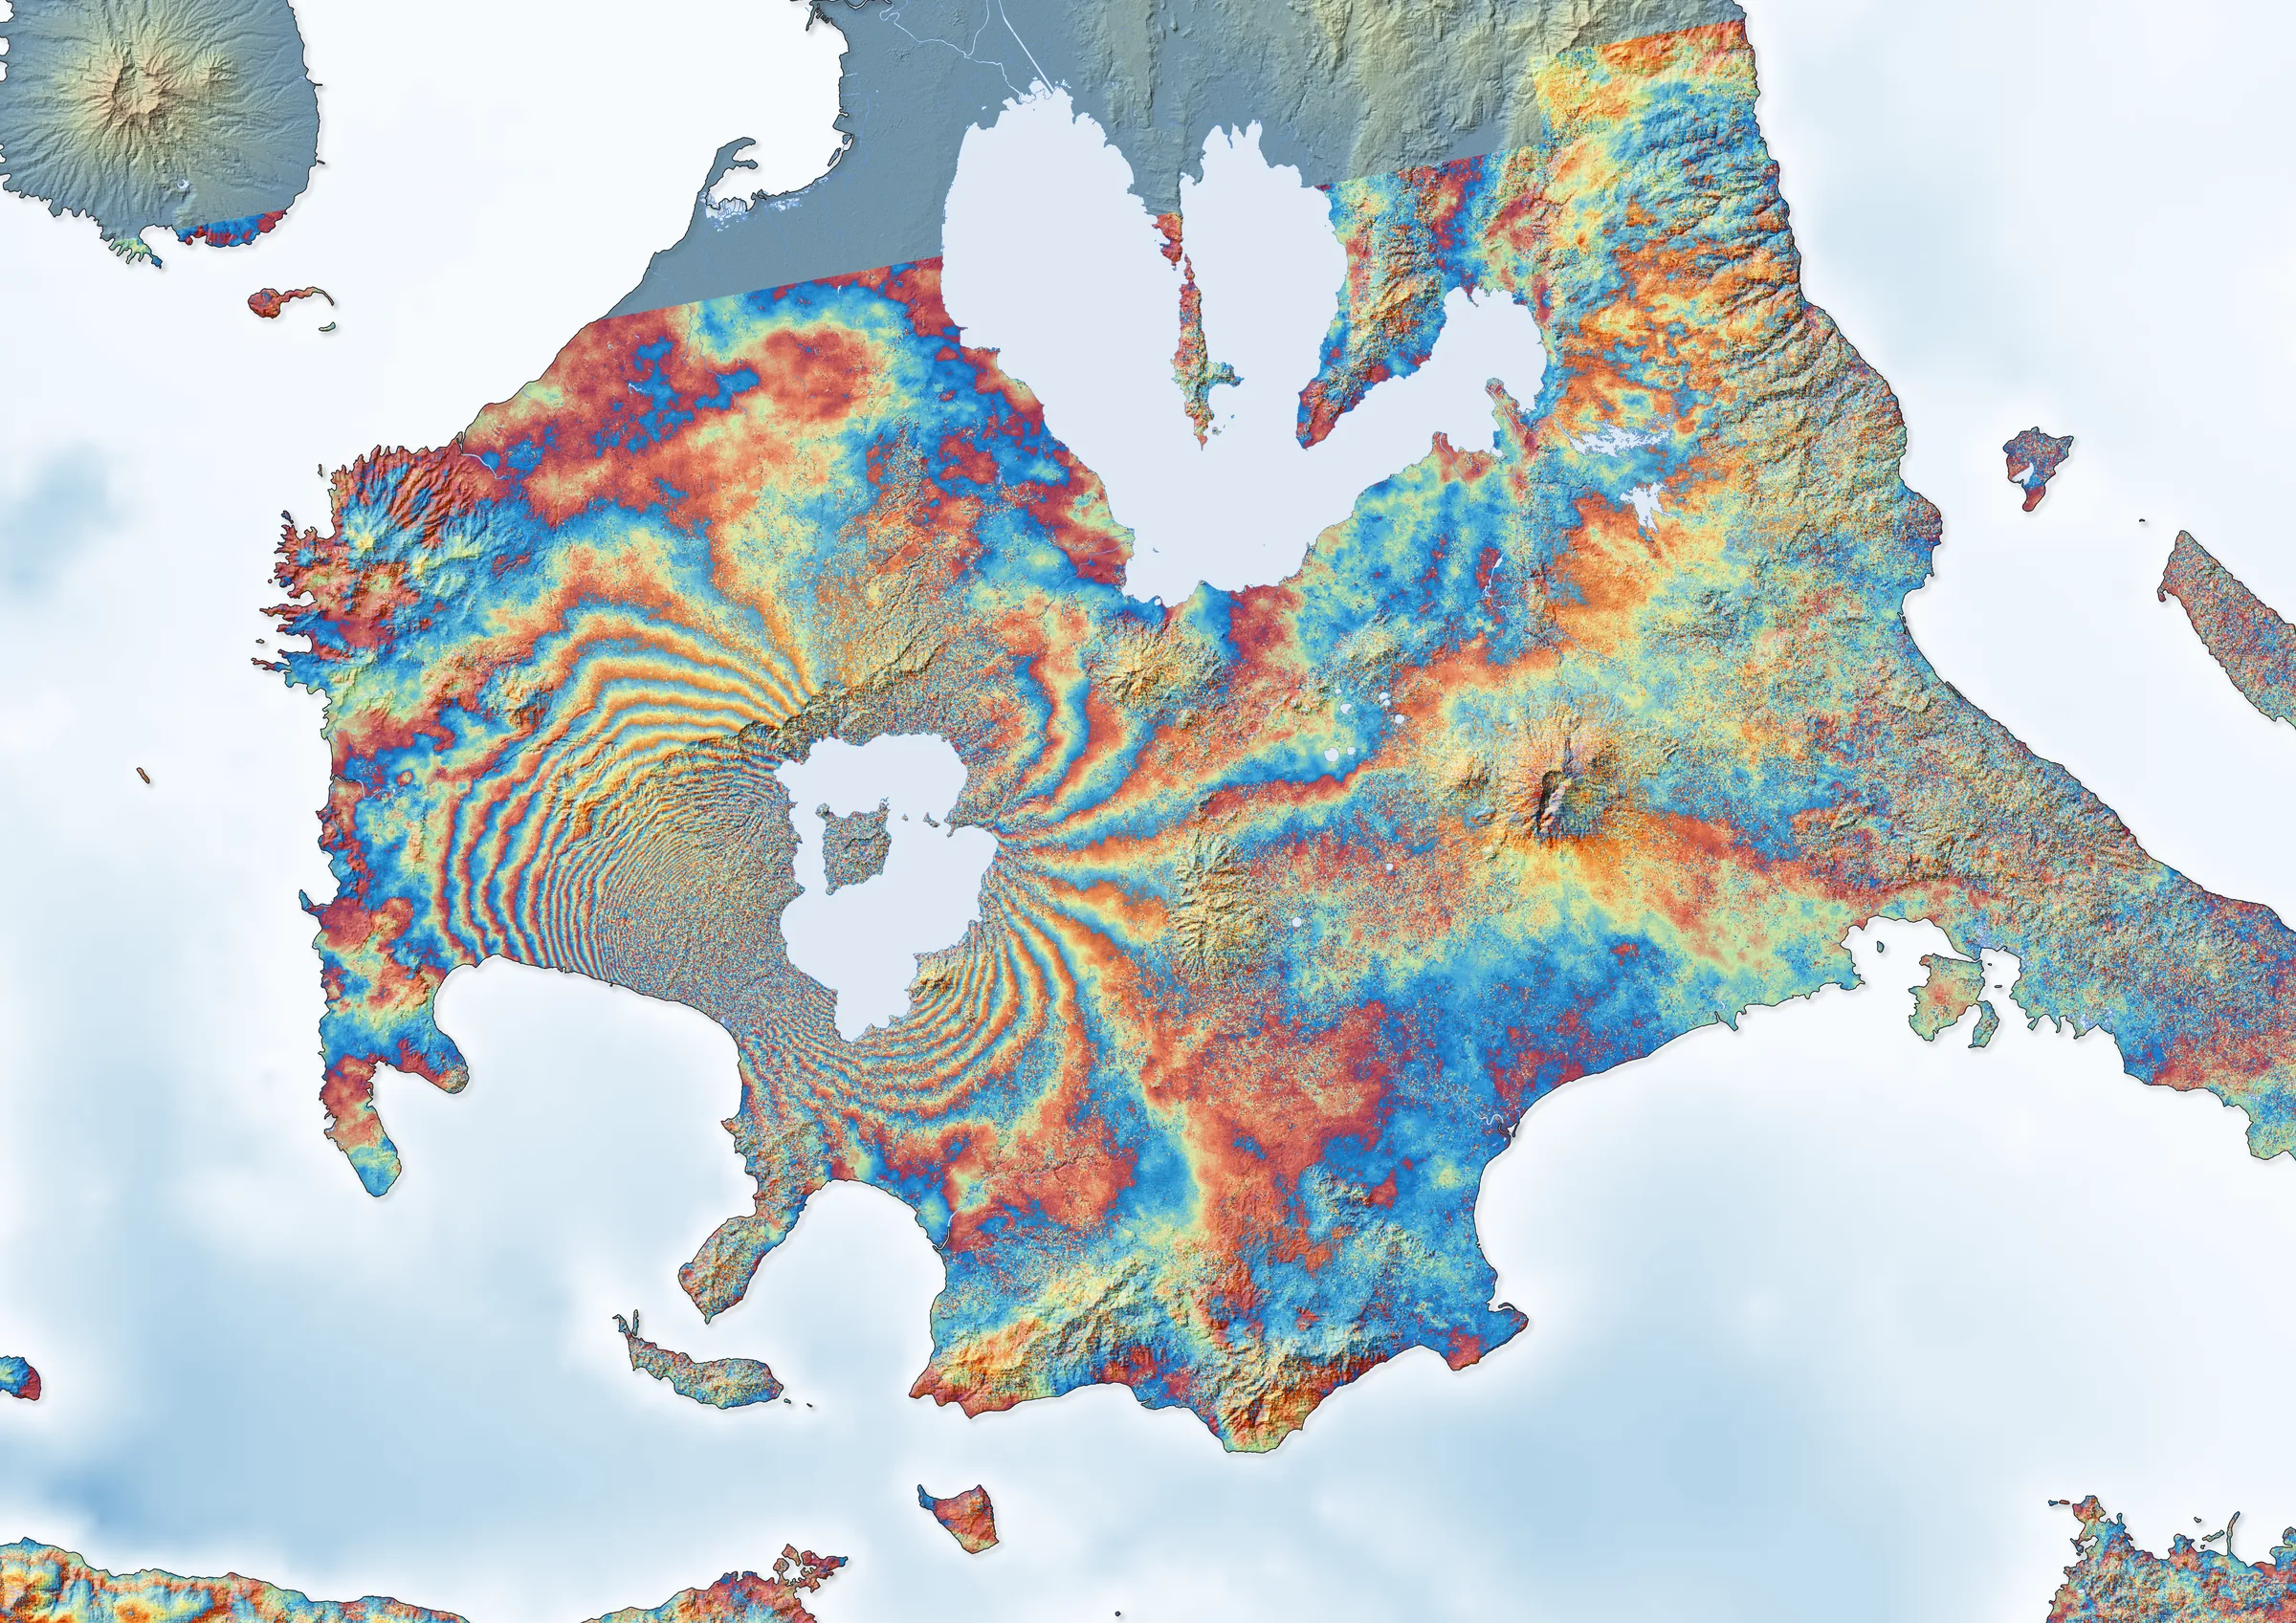
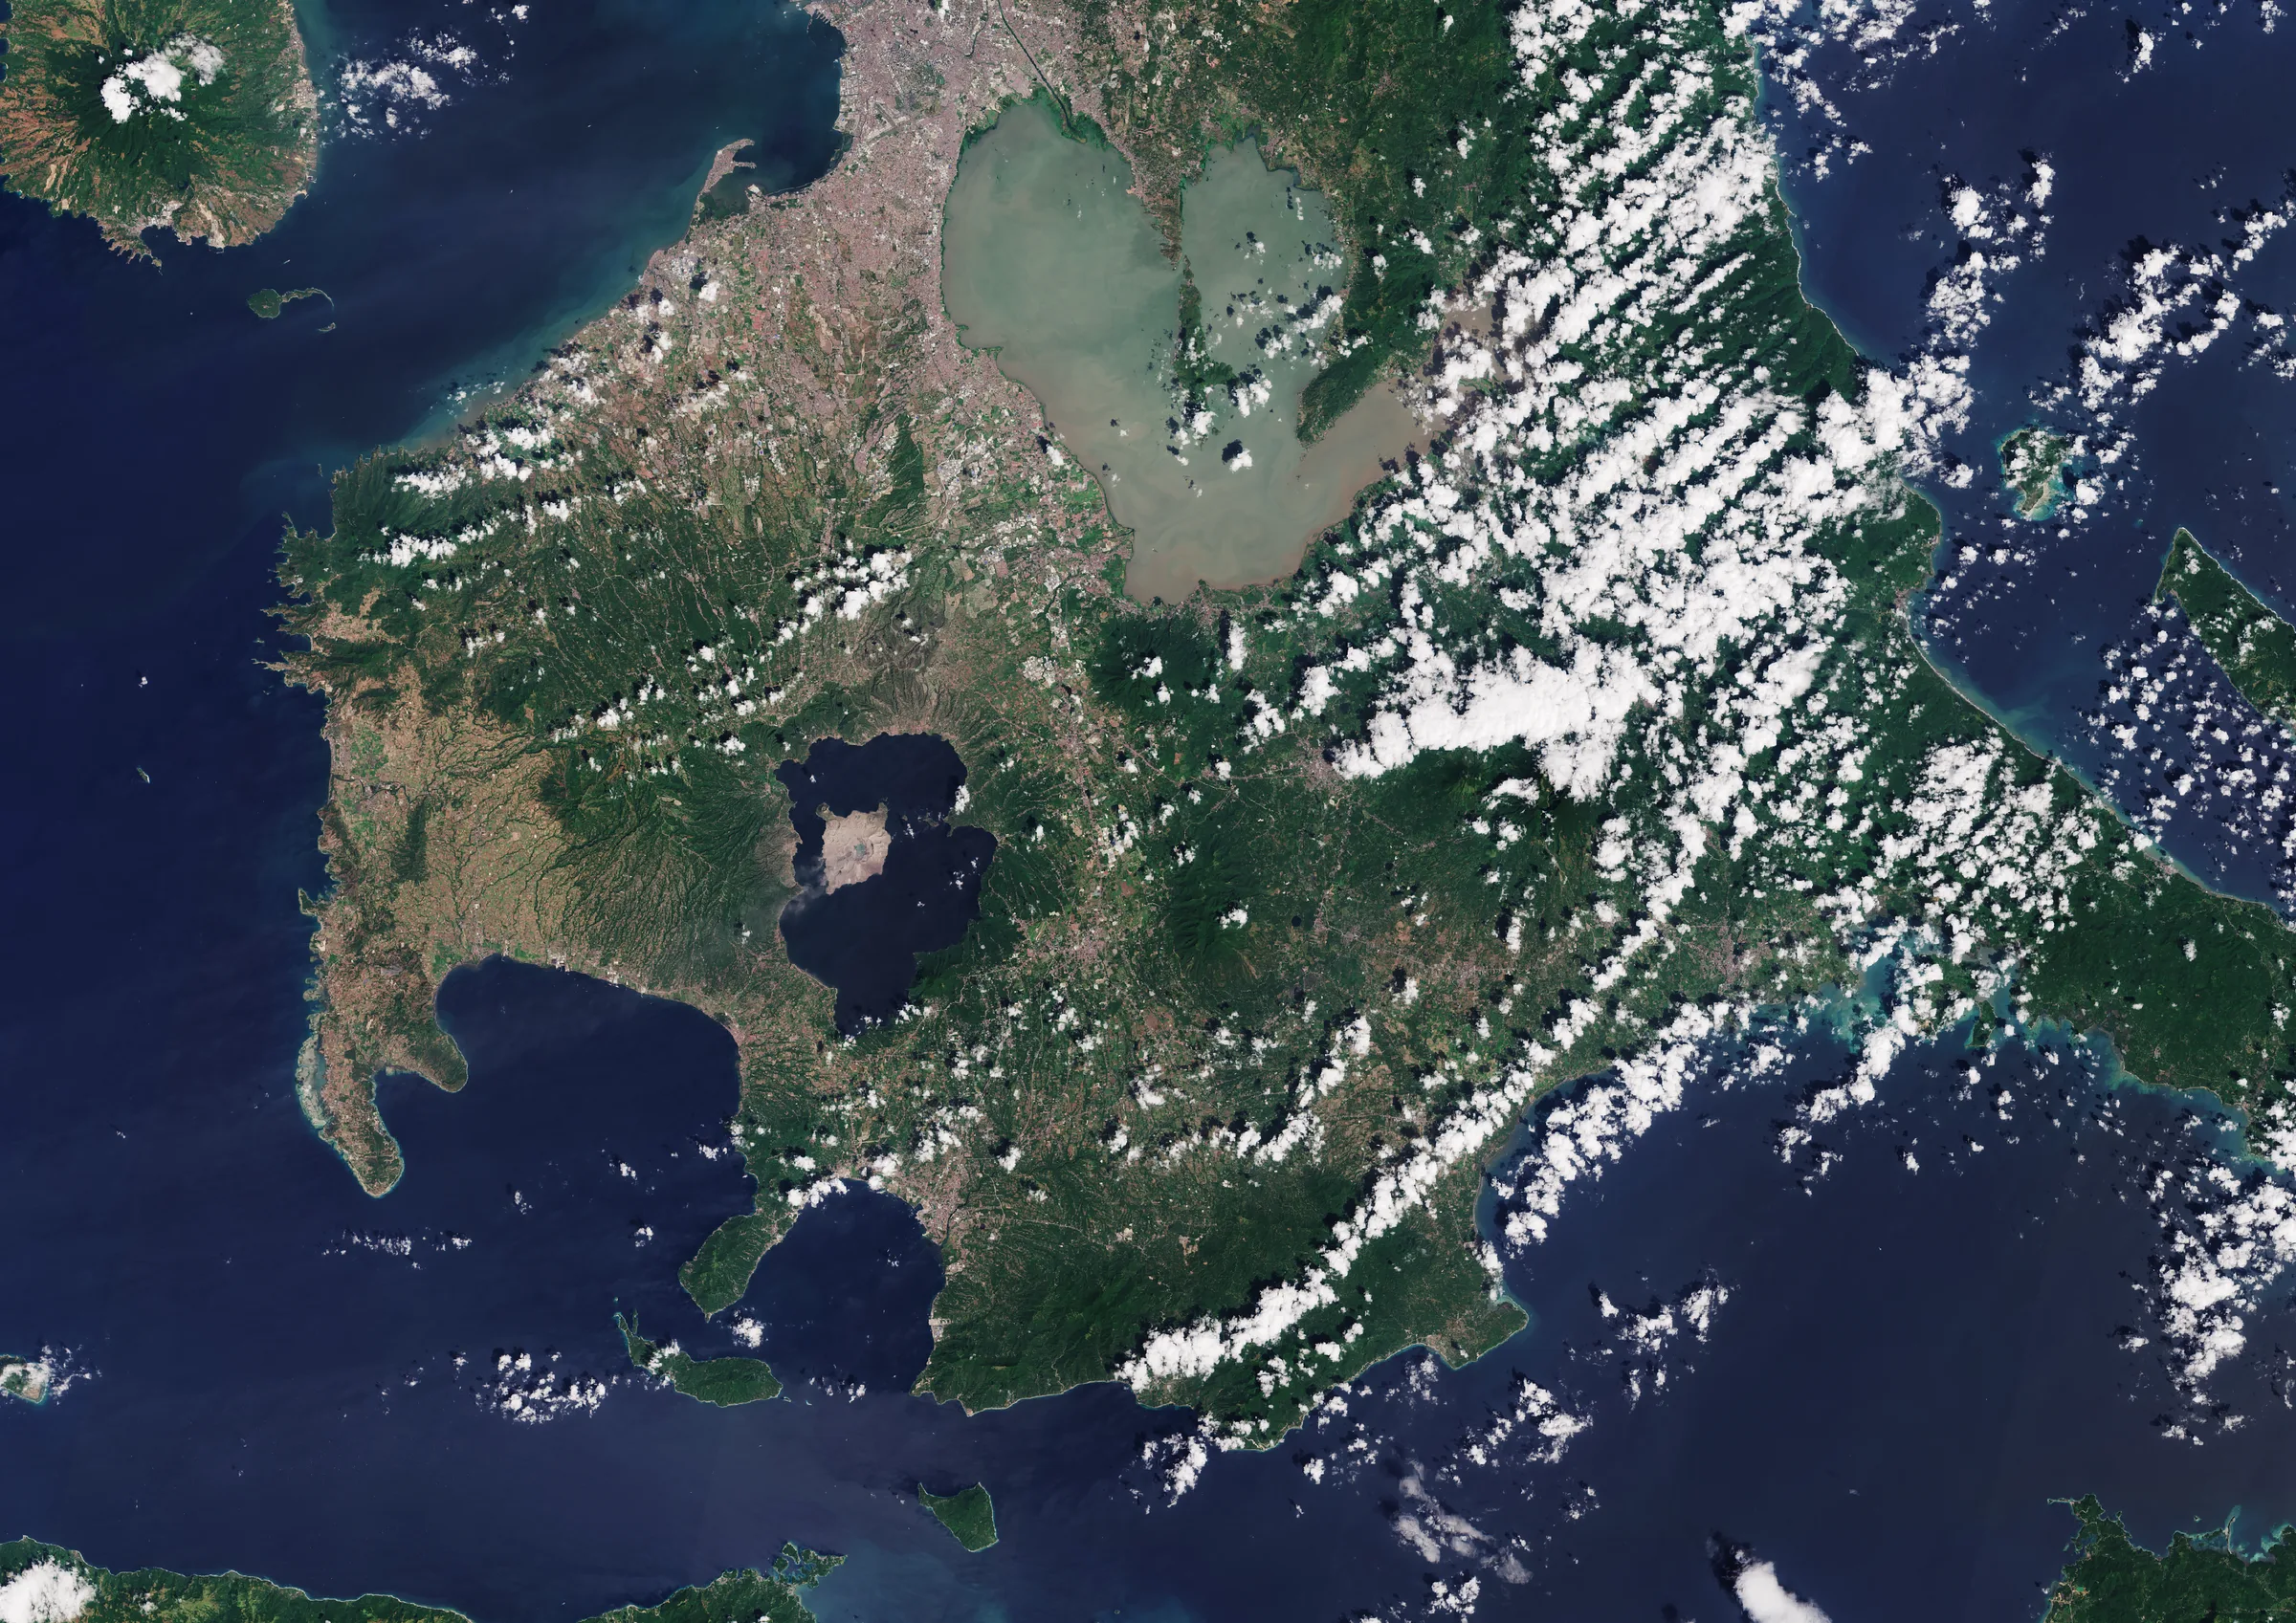
The dense, lobed fringe pattern around Taal Lake shows the ground being pushed apart and lifted as magma forced its way sideways beneath the volcano. Studies of the radar data concluded that, during the eruption, about 0.5 km³ of magma left a reservoir some 5 km deep while a lateral dike of about 0.6 km³ was emplaced, and that most of that magma never reached the surface. The fissures seen on the ground line up with this movement.
Mapping what changed
Radar can also map changes directly. The image below combines Sentinel-1 acquisitions from before and after the eruption: surfaces that changed between the two dates show up in red.
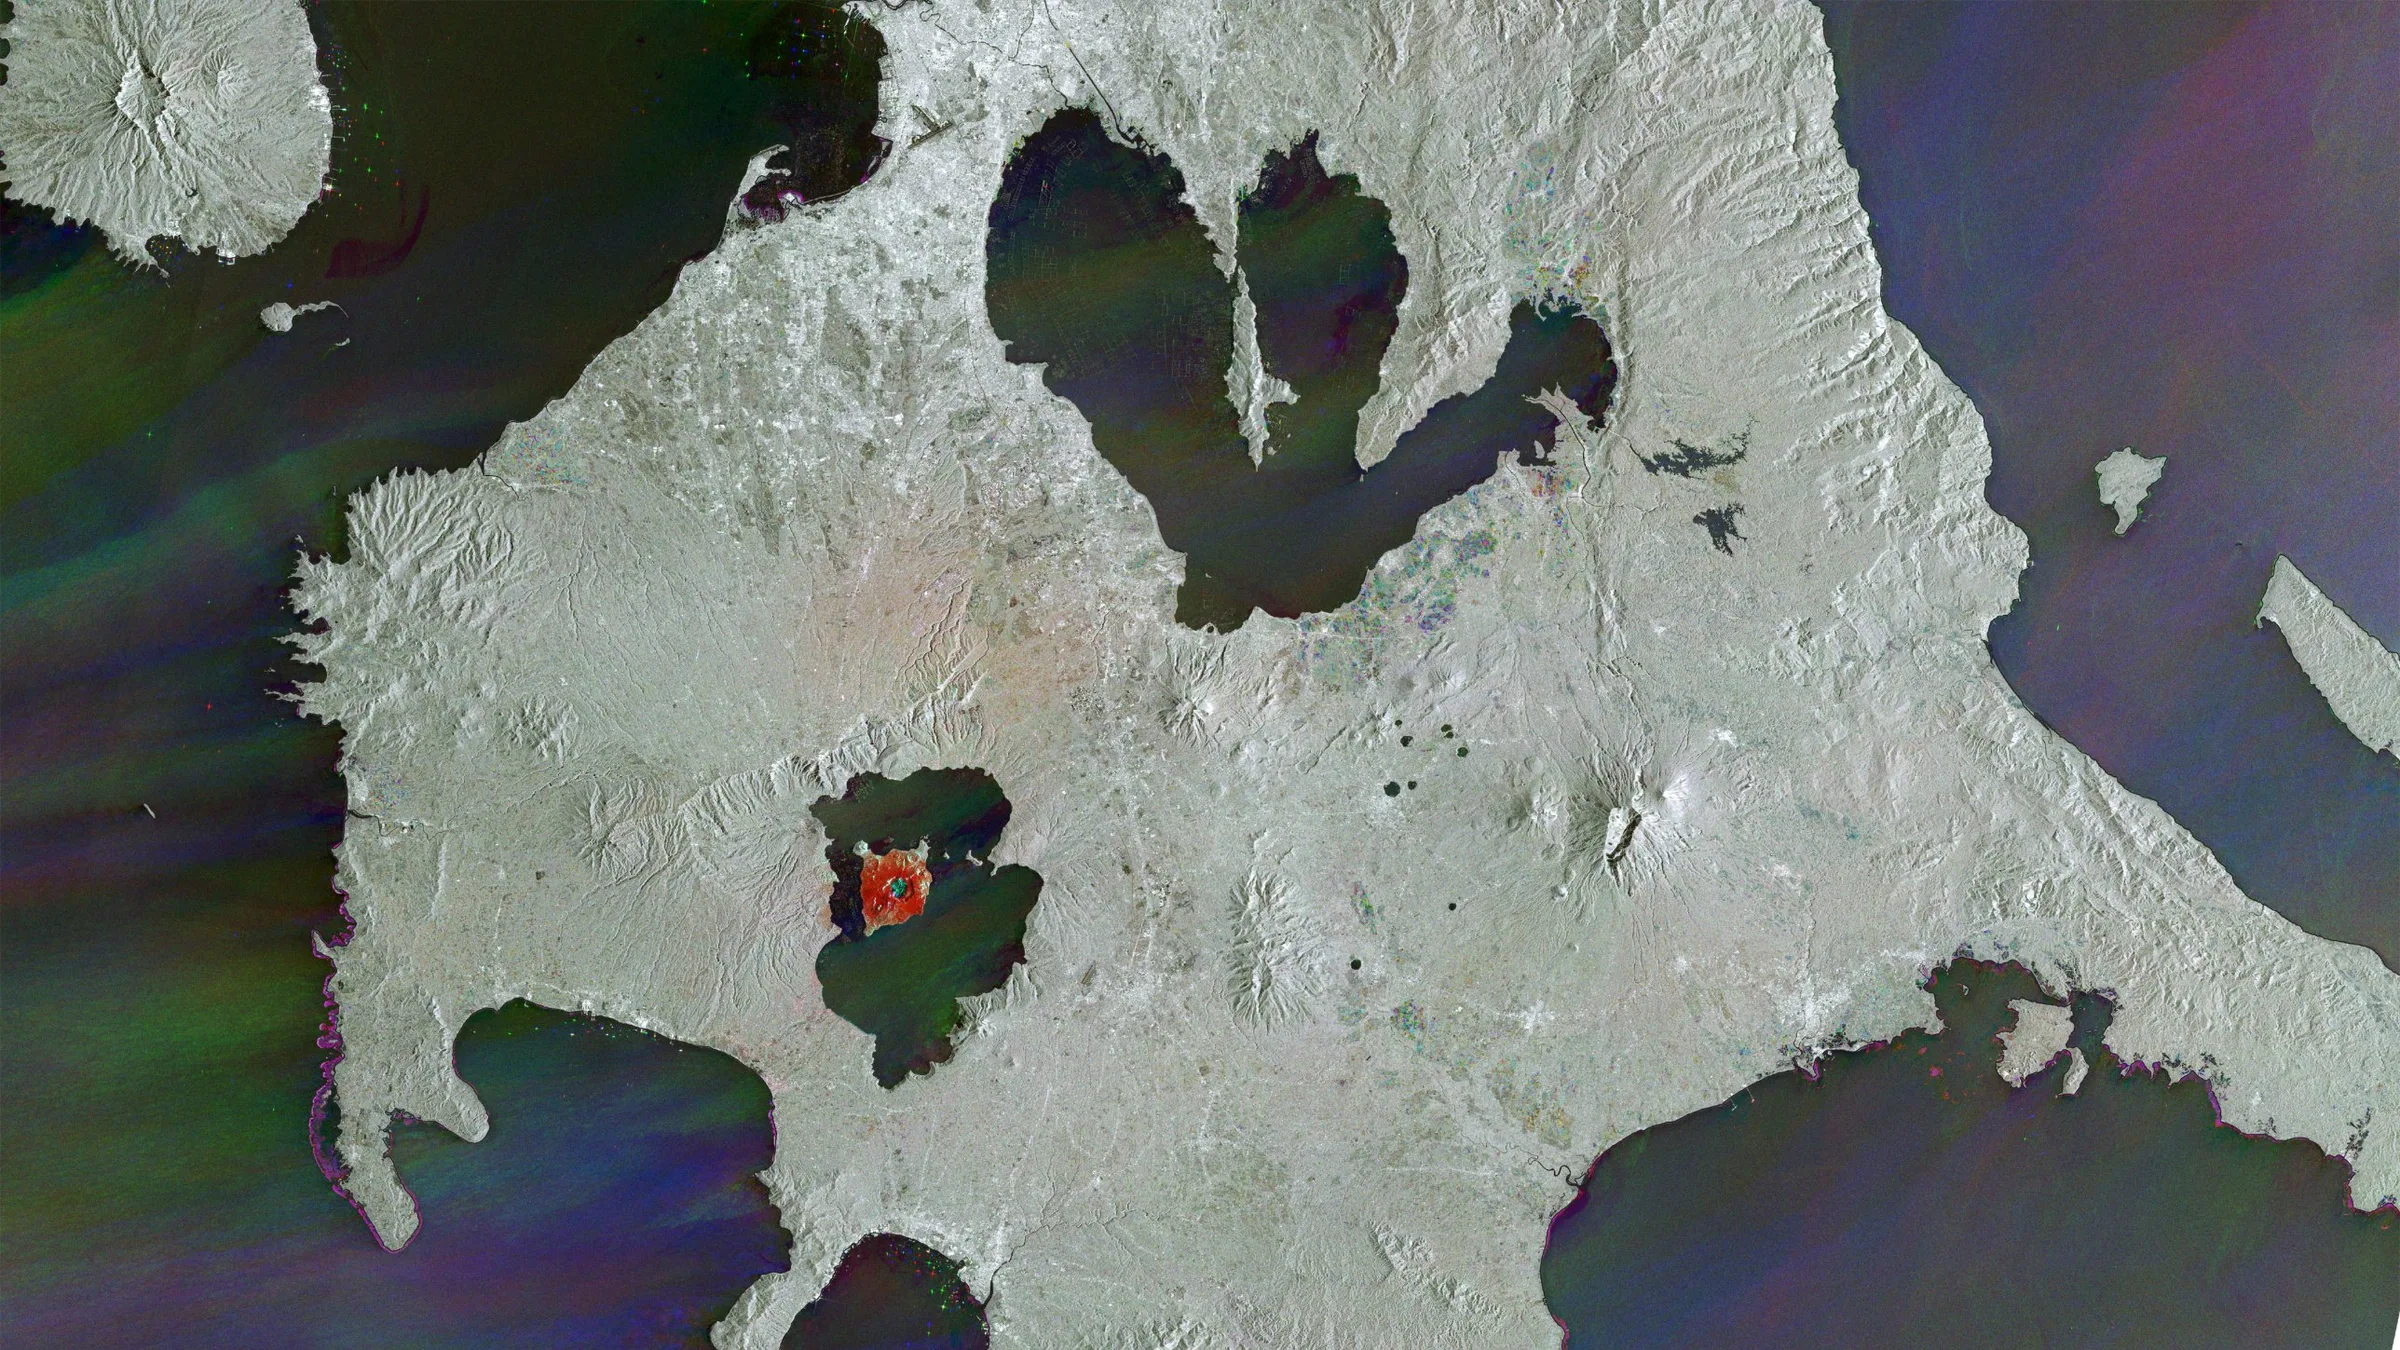 Sentinel-1 change detection combining pre- and post-eruption radar images, [DATE] and [DATE]. Red marks surface changes caused by the eruption. Credits: Contains modified Copernicus Sentinel data (2020)
Volcano Island stands out: its surface was transformed by the thick, wet ash deposited during the eruption, while the rest of the region changed far less.
Explore the scene
Zoom into the full-resolution Sentinel-2 image to see the ash-covered Volcano Island and the towns around the lake.
Why radar matters in a volcanic crisis
During an eruption, clouds, ash plumes and darkness hide the volcano from optical satellites. Radar sees through all three, day and night. At Taal, satellite radar gave scientists and civil protection a view of the deformation during the peak of the crisis, when access to the volcano was impossible.
Sources: PHIVOLCS eruption bulletins (January 2020); Bato et al. (2021), The 2020 eruption and large lateral dike emplacement at Taal Volcano, Philippines: insights from satellite radar data, Geophysical Research Letters, doi:10.1029/2021GL092803.
Credits: Contains modified Copernicus Sentinel data (2020), processed by Manos Lagoudakis.