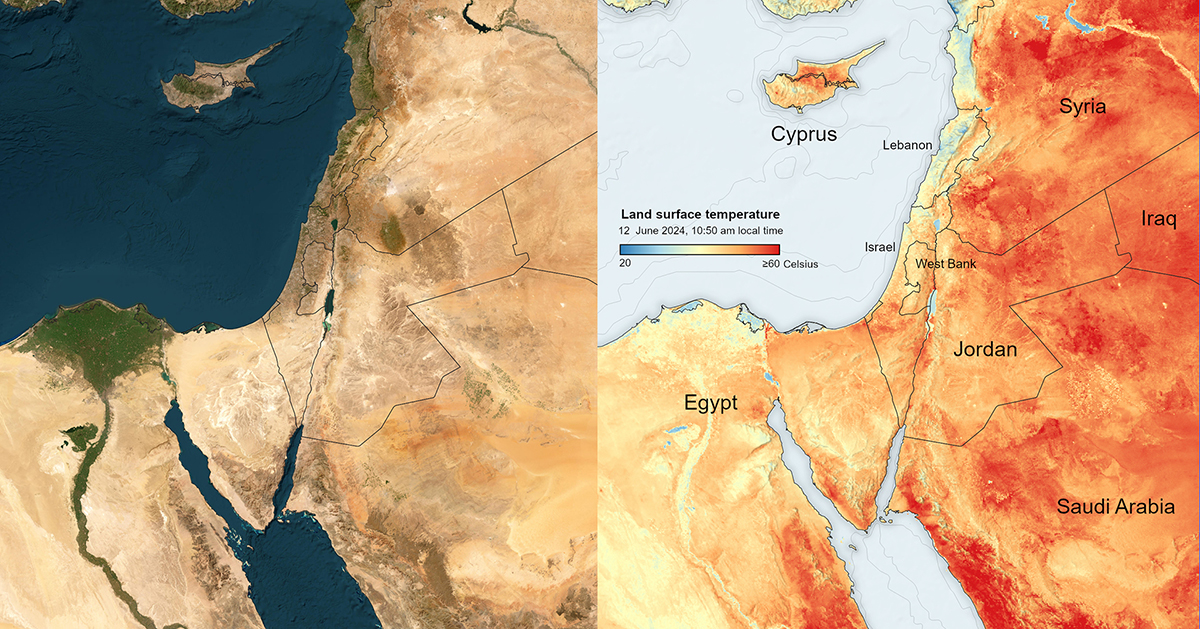
A Hot Middle East Morning
LST of the Middle East
This land surface temperature (LST) image was acquired on June 12, 2024, at 10:50 AM local time by the SLSTR instrument onboard the Copernicus Sentinel-3 satellite.

In many areas, the LST exceeds 60 degrees Celsius. As expected, water bodies, mountainous regions, and coastal areas have lower temperatures.
Differences with AT
Unlike air temperature (AT), which is measured at a specific height (usually 2 meters), LST represents the thermal radiation emitted from Earth’s surface. In simpler terms, it’s how hot the ground would feel to your touch.
LST can fluctuate more dramatically than AT. For example, on a sunny day, land surfaces like asphalt can absorb significant solar radiation, causing the LST to be much higher than the AT. Conversely, at night, land surfaces lose heat faster than air, sometimes resulting in a lower LST.
The table below shows the differences between LST and AT at selected locations visible on the map.
Things to Consider When Interpreting LST Maps:
- Spatial resolution: The instrument takes one reading per unit area. For example, the SLSTR instrument of Sentinel-3 has a resolution (unit area) of 1 square kilometre. All the variations of temperature within this square kilometre are represented with one reading.
- Temporal resolution: Sentinel-3 takes one reading per day. The mapped LST quantifies the temperature at the time of acquisition of the data.
- Conversion from radiance to LST: A series of algorithms that include calibration, conversion to brightness temperature, emissivity correction, atmospheric correction.. This process can introduce errors.
- Cloud filtering: Clouds can affect readings, so data filtering is crucial. Clouds are also not uniform. Thin clouds might escape filtering and affect the quality of the LST measurement.
The Bottom Line:
LST quantifies the energy emitted by the ground at the time of image acquisition. It can also indicate perceived heat and potential discomfort, but it’s not the same as AT and should be used with a clear disclaimer. Combining LST and AT data can help us understand how we experience heat and heatwaves in a warming world.
This article was also posted on my Linkedin account.
Credits: Copernicus Sentinel-3 for the LST data and Esri for the satellite base map

